
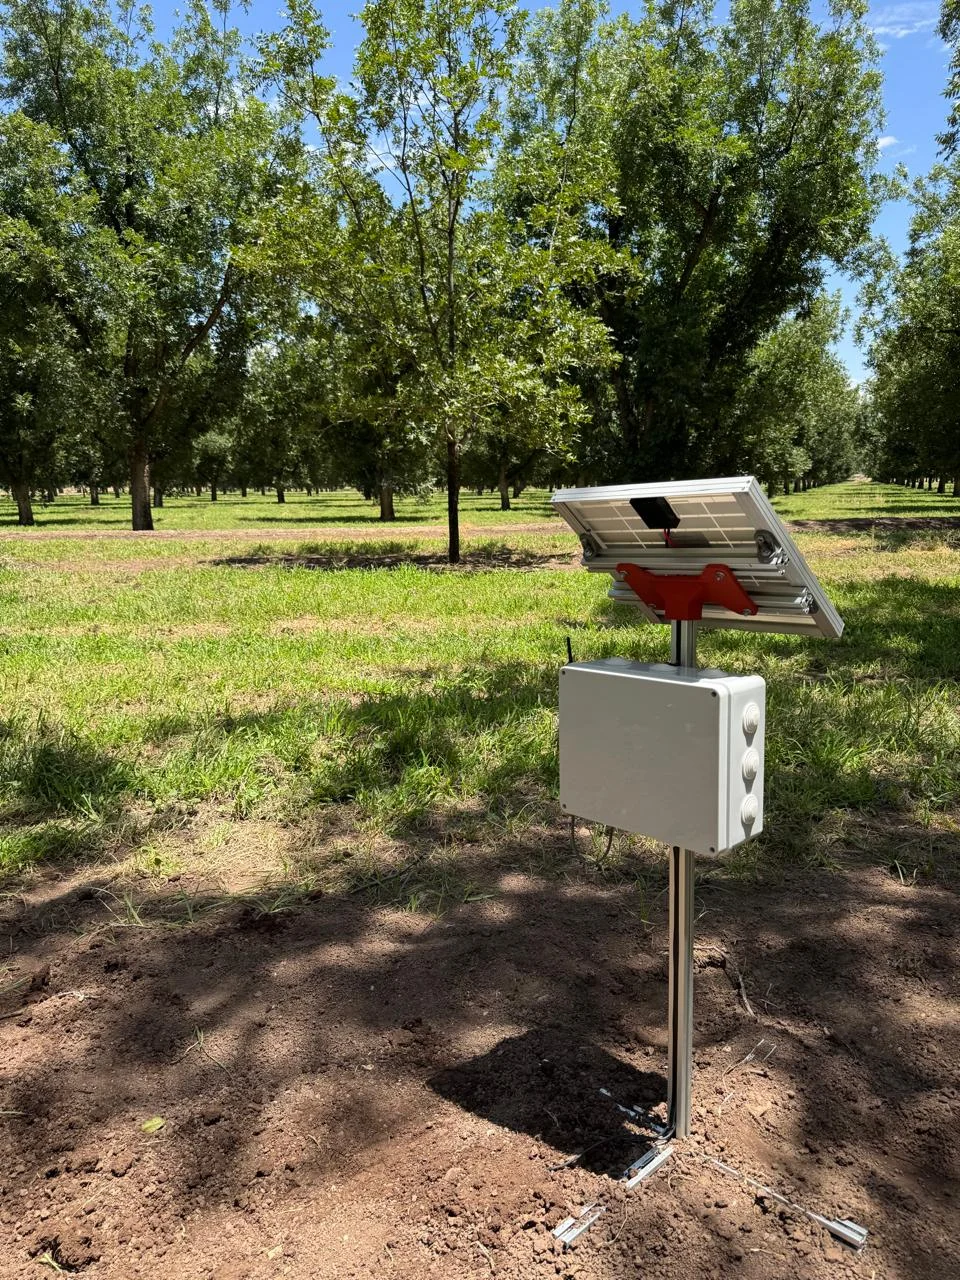
SMART AGRICULTURE · MADE IN CHIHUAHUA, MEXICO
Technology that cares for today,
intelligence that irrigates the future.
SAVIA monitors soil, weather, and crops to help you understand when to irrigate, how much, and why. Less guesswork. Better-informed decisions.
Soil + weather + NDVILocal and online operationBuilt for real-world fields
Explore
WHAT IS SAVIA?
Your crop changes
every day.
Irrigating without knowing what is happening in the soil, weather, and crop can waste water and energy and limit yield potential. SAVIA turns that information into clear, useful irrigation guidance.
Less guesswork. Greater confidence in every decision.
SAVIA
It's not about irrigating more.
It's not about irrigating more.
It's about irrigating at the right time.
We measure conditions around the roots and combine those readings with weather, NDVI, and field information to help you identify areas needing attention and irrigate more precisely.
Timely irrigationTake action when your crop actually needs it.
Lower costsReduce unnecessary water use, pumping, and interventions.
Greater yield potentialImprove crop management with real-world context.
We don't install sensors just for the sake of it.We design systems that turn each measurement into a better irrigation decision.
PHASE01
MONITORINGFrom soil measurements to better decisions
CURRENT FOCUS
HOW SAVIA WORKS
A reading starts underground.
The decision ends up in your hands.
A reading begins underground, travels through the system, and reaches your screen. We combine sensor data with meaningful context to help you understand irrigation needs.
PHASE 1 · MONITORING
The data has arrived.
The data has arrived.
Now, what does it tell us?
You've seen how a reading travels from the root zone. Now discover how it can inform a better irrigation decision.
01 / THE ROOT ZONE
What matters happens below ground.
Sensors reveal conditions we cannot see. Every field is equipped according to the measurements it needs.
MoistureTemperatureElectrical conductivityWater potential
First step: understand what is happening around the roots.
02 / THE CONTEXT
A reading means more when it has context.
Measurement history reveals changes over time. Weather, forecasts, and NDVI imagery add context to help interpret what is happening in each zone.
HistoryWeatherForecastNDVI
Second step: understand how a reading changes over time.
03 / YOUR DECISION
Technology informs. You decide.
SAVIA brings together readings, history, and location so you can spot trends, review areas needing attention, and assess irrigation timing.
When to irrigate?How much to apply?Why?
The goal: make informed decisions, not guesses.
PERSPECTIVE 01 / 03
FIELD · CONCEPTUAL VIEW 01 / 03
A reading starts near the roots.
The grower remains in control. SAVIA supports decisions through monitoring; automated irrigation remains in development. Illustrative visualization; no live measurements.
PHASE 01 · MONITORING SCALE OF INFORMATION
One point measures the soil.
Context helps us understand the surrounding area.
We place a sensor module at a strategic point within the irrigation zone. This reading is real and localized. Combined with weather, forecasts, historical records, and NDVI imagery, it helps us better interpret what happens around it.
SAVIA nodeReading at a fixed location
Direct measurement Contextual analysis area
DISCOVER THE DIFFERENCE
From a single reading to a broader understanding.
Discover why the value is not just how many sensors we install, but also how we interpret their readings.
IN-FIELD MEASUREMENT
We know what happens right here.
The module measures soil variables at its installation point: moisture, temperature, and depending on the selected sensors, electrical conductivity or water potential.
Direct soil data. Specific to its measurement point.
MEASUREMENT + CONTEXT
Now we understand more than that single point.
By combining historical readings, weather conditions, forecasts, and crop vigor (NDVI), we can identify patterns and differences within an irrigation zone.
Contextual view of the zone. More information to decide what to inspect and where.
The key: measure where it matters and understand what surrounds it. The number of nodes depends on crop type, field size, and variability: a single reading does not measure the whole field. Weather and NDVI add context but do not replace additional measurements when needed.
PHASE 1 · MONITORINGWHAT WE MEASURE AND WHY
each variable answers
a different question.
Numbers are only useful when they answer a question. Each measurement reveals a different part of crop conditions.
Soil moisture
How much water is there?Tracks how the root zone dries and rehydrates before and after irrigation.
Soil temperature
What conditions surround the roots?Adds context about root-zone conditions and helps interpret other measurements.
Electrical conductivity
How are salts behaving?Provides an indication of dissolved salts and can help track changes related to fertilizer management.
Water potential
How available is the water?Knowing the amount is not enough. This variable helps indicate how easily plants may extract water from the soil.
Weather and forecast
What comes next?Air temperature, humidity, and forecasts help put soil readings in environmental context.
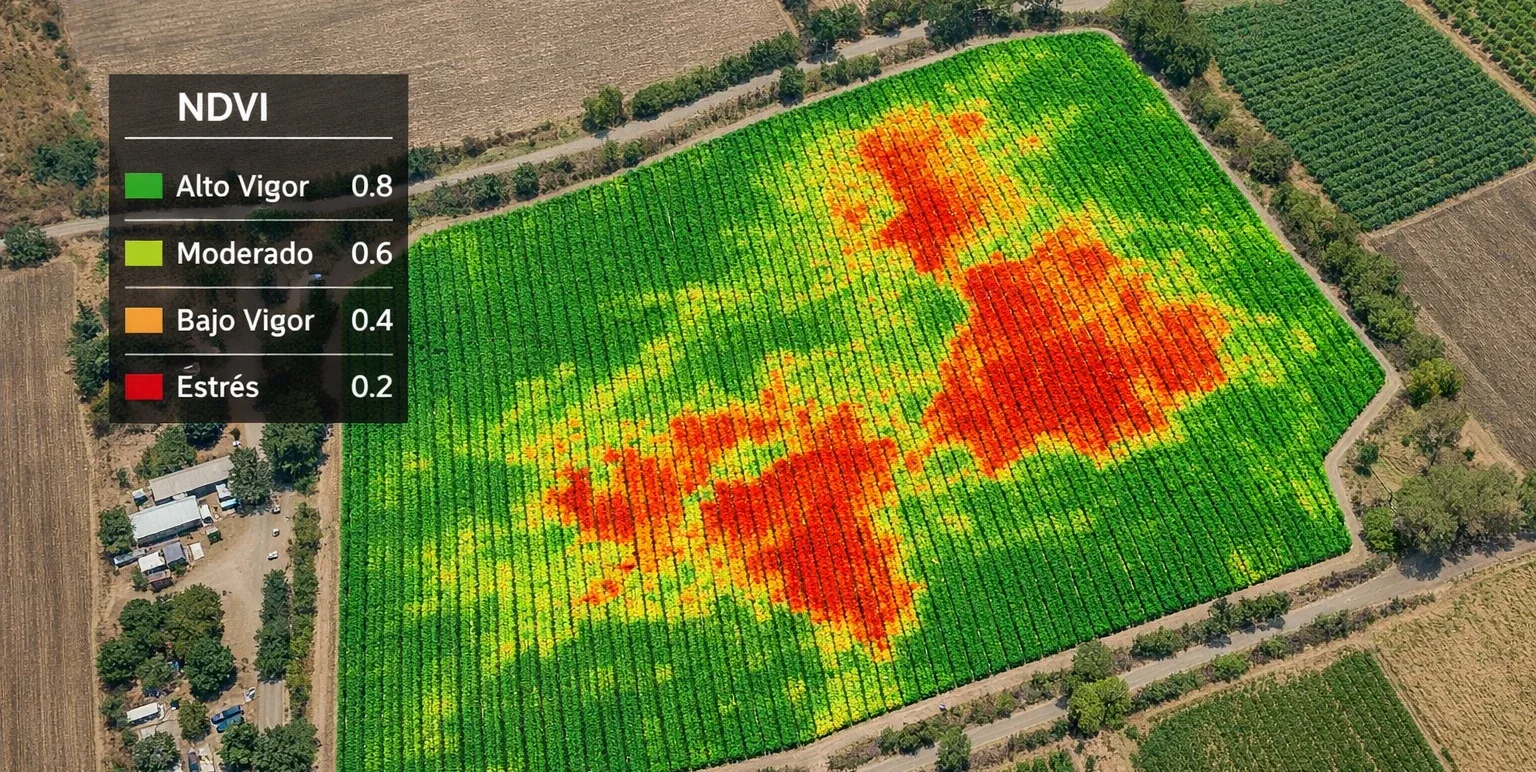
Crop vigor · NDVI
What is NDVI?NDVI imagery helps assess crop vigor from above. Greener areas typically indicate stronger growth, while yellow, orange, or red areas may warrant closer inspection.
How do we use it?
To locate differences across the zone and complement sensor readings. It must be interpreted alongside measurements and field inspection.
ONLINE · OFFLINE · REAL-WORLD FIELDS
SAVIA adapts to the field.
Not the other way around.
A field should not be excluded because Wi-Fi or a convenient power outlet is unavailable.
Autonomous in the irrigation zone
Independent power and long-range wireless communication with the central station.
Sensor→Node→Central station
Online synchronization
The central node receives readings and uploads them to the cloud so you can access SAVIA remotely.
Central station→Cloud→Web app
The system keeps working
The system can operate locally and synchronize later. Cellular connectivity via a SIM can also be configured.
Local+Optional SIM
What does the grower need?A standard installation needs power for the central node and internet access. If these are unavailable, we design an alternative setup, including autonomous central stations and cellular connectivity.
PHASE 01 · MONITORING · SAVIA IN THE FIELD
From design to the field.
SAVIA in the field.
Two crops, two real agricultural settings in Chihuahua. See how our technology is installed alongside the plants, where monitoring begins.
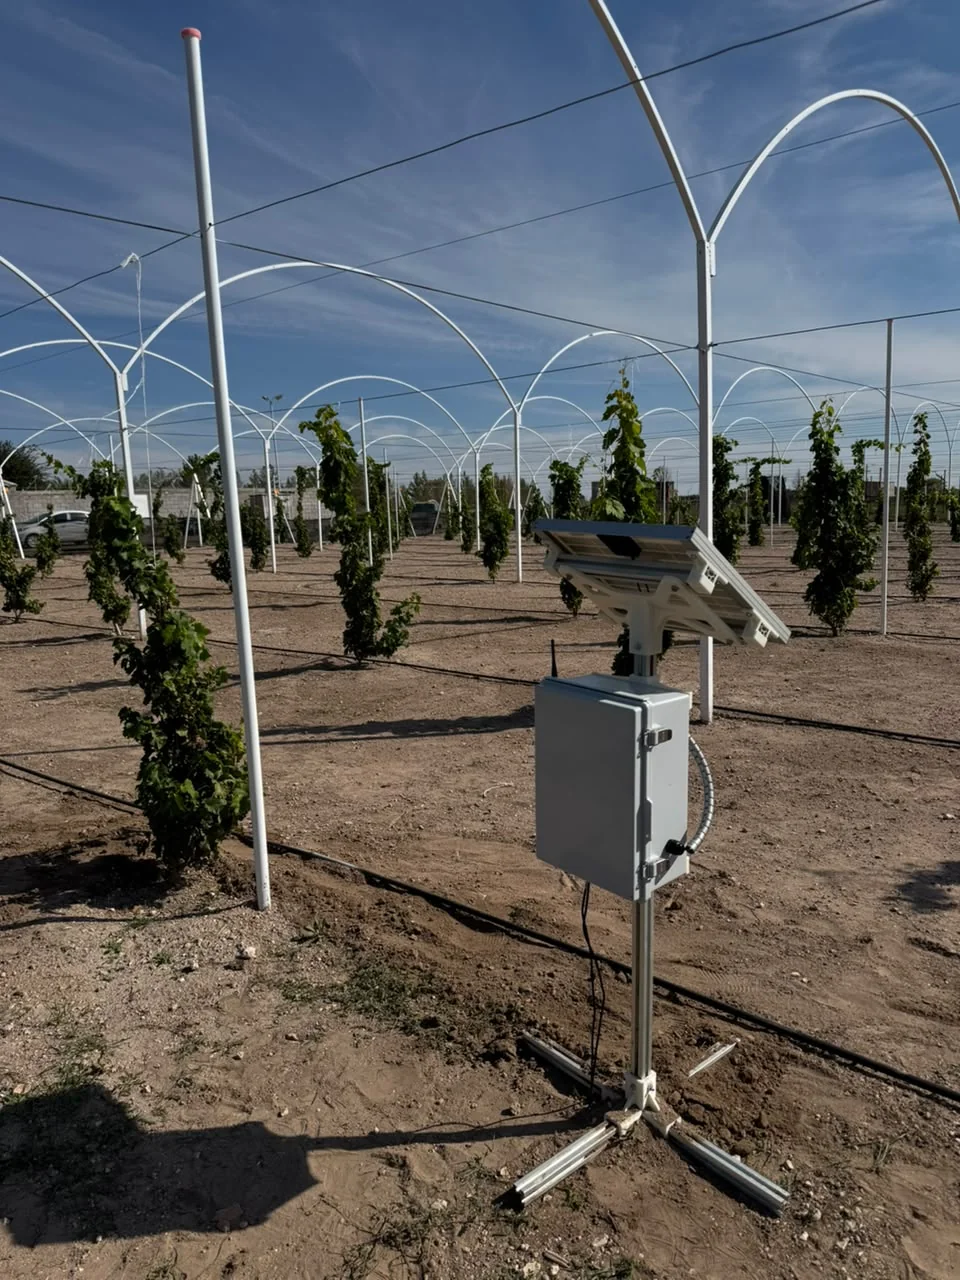
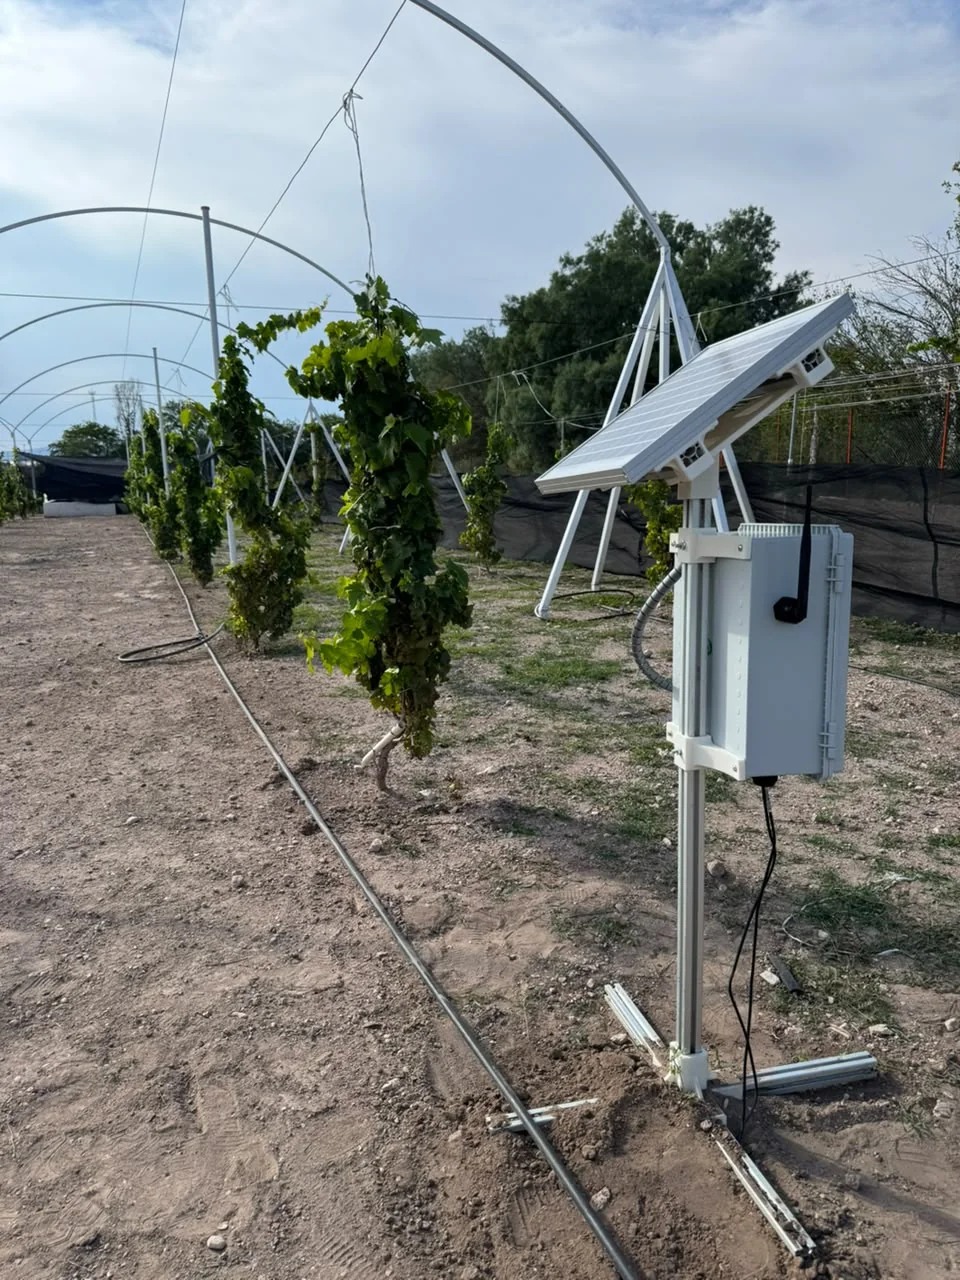
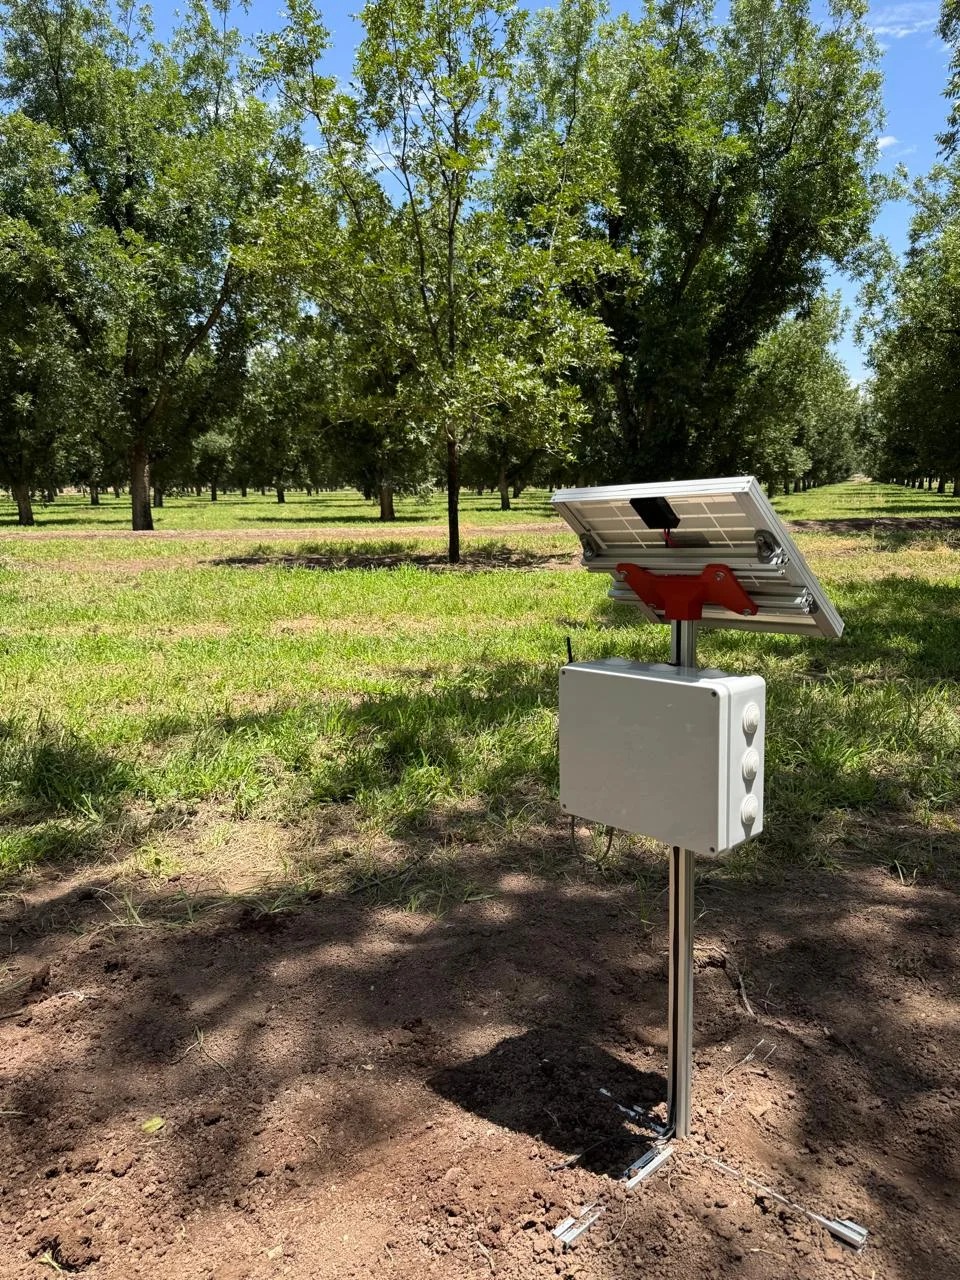
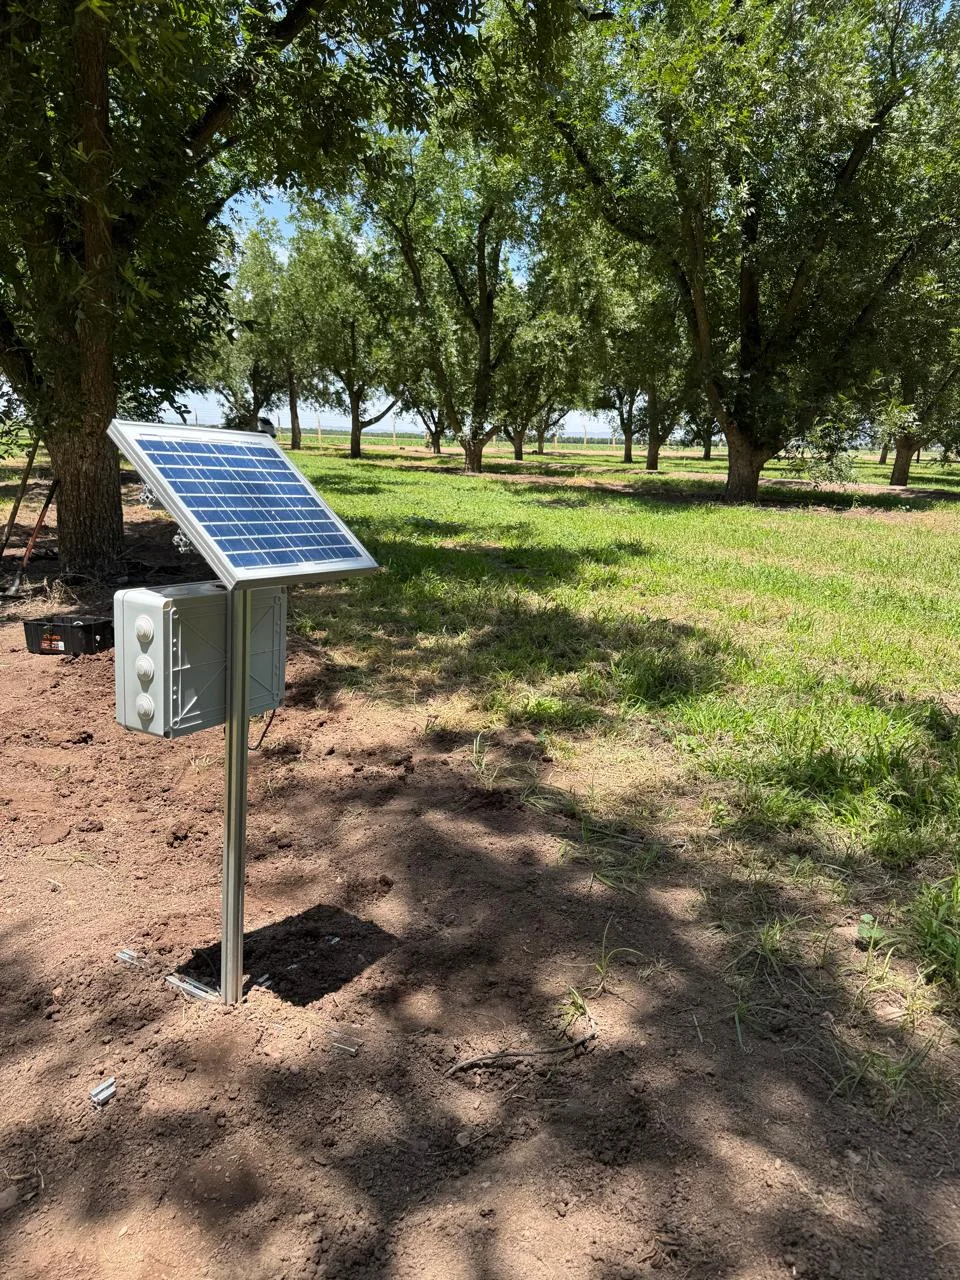
Technology should adapt to each field.
Real photos of SAVIA installations. Equipment layout and configuration may vary by field conditions.
PHASE 01 · MONITORINGSAVIA PLATFORM
The app isn't just about showing charts.
It's about showing you what's happening.
Readings, history, maps, and node status in one place. The SAVIA platform brings field information together so you can spot changes, see where they happen, and know what to review.
THE APP HELPS YOU ANSWERClear information for decisions
01
What's happening in my field?
View recent measurements and node status at a glance, without checking every sensor separately.
OVERVIEW AND STATUS
02
What changed over time?
Review the history and compare soil conditions before and after irrigation to identify trends.
HISTORY AND TRENDS
03
Where is it happening?
Find nodes on the map and connect each reading to its location. The reading has context, not just a number.
MAP AND LOCATION
04
What needs my attention?
Compare readings over time to spot changes and decide which area to inspect first.
MONITORING AND JUDGMENT
The field generates readings. SAVIA puts them in context. You stay in control of irrigation decisions.
PHASE02
AUTOMATIONFrom information to irrigation action
IN DEVELOPMENT
Monitoring helps explain why to irrigate.
Automation turns a decision into action.
SAVIA recommendation
When, how much, and why.
Irrigation command
The command would travel via long-range wireless communication.
Valve + pump node
The selected zone would open while the pump runs in coordination.
Irrigation carried out
Water delivered to the selected zone based on an informed decision.
Today: SAVIA focuses on monitoring and visualization to support irrigation decisions. Phase 2 is in development: the coordinated control of solenoid valves and pumps shown here represents a planned future capability.
NEXT CHAPTER · SAVIA
SAVIA is the next stage.
Measurement is only the beginning; learning from the field comes next.
We're developing an agronomic intelligence layer to combine sensor readings, weather, and soil characteristics, aiming to provide context-aware, explainable irrigation and management guidance.
Sensors+Weather+NDVI+Soil→Recommendations
GET STARTED WITH SAVIA
What does your field need?
First, we understand it.
We don't start with a generic package. We tailor the configuration to the zones and decisions you want to improve.
Tell us about your crop
Area, zones, irrigation method, soil, and available infrastructure.
We define what to measure
Variables, critical points, sensors, and required number of nodes.
We install and connect
Distributed nodes, central node, and connectivity suited to the site.
Start making data-driven decisions
Review zones, alerts, history, and guidance in SAVIA.
LET'S TALK
Want to see SAVIA
in your field?
Tell us about your crop or property. Leave your details and our team will contact you.
FREQUENTLY ASKED QUESTIONS
What matters,
straightforward.
Common questions before installing SAVIA.
What is SAVIA?
An agricultural monitoring system that combines soil, weather, and crop information to help you make better irrigation decisions through a web platform.
How many nodes do I need?
As a starting point, one distributed node per irrigation zone. The final number depends on the area, soil variability, crop, and monitoring goals.
Do I need internet?
Not continuously. The field can keep collecting readings while the central station works locally and syncs when a connection is available; cellular connectivity via SIM is also possible.
What do I need to install SAVIA?
A standard setup requires power for the central node and internet access. Distributed nodes are autonomous. If those conditions are unavailable, we design an alternative power and connectivity setup.
Does SAVIA control irrigation automatically?
Today we focus on monitoring, visualization, and guidance. We are developing the next phase: coordinated solenoid-valve and pump-node control for automated irrigation.
Does electrical conductivity measure pH?
No. EC reflects dissolved salts and can provide context about fertilization, while pH measures acidity or alkalinity. They are different, complementary variables.